AC Magnetic Field Meter
from KEUWLSOFT
Privacy Policy for AC Magnetic Field Meter
Can be downloaded at Buy Me a Coffee (coffee optional).
Supporters on Patreon can find the app here.
Can be downloaded at Buy Me a Coffee (coffee optional).
Supporters on Patreon can find the app here.

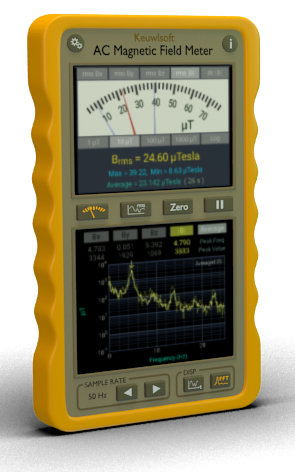
AC Magnetic Field Meter
Turn your device into an AC magnetic field meter by using its magnetic field sensor.
Measure the RMS values from AC magnetic fields.
Fast Fourier Transform (FFT) to obtain the magnetic field frequency spectrum.
• Gauge to show the RMS B-field in the X,Y or Z directions, or from the magnitude. Or alternatively show the DC magnetic field.
• RMS graph to show the gauge readings over time.
• Lower display shows time series data or a FFT from it.
• Peak indicators for the frequency spectrum.
• Save graph data to file.
• Units of Gauss or microTesla.
Magnetic field sensors will vary in sampling speed, resolution and accuracy from one device to the next. For indication only.
Don't put a strong magnet too close to your device – you risk damaging the sensor/device. However, waving your device around in all three axis should restore the magnetic field sensor to good working order.
This app is designed for indication and educational purposes only. Always use a suitable calibrated more accurate device appropriate for the situation when required.
User Guide
The magnetic field sensor measures the magnetic flux density, B, in micro Tesla (µT). Units of Gauss are also commonly used to measure magnetic flux density. 1 Gauss = 100 µT. Select between µT and Gauss in the settings.
The Root Mean Square (RMS) values of the magnetic field are measured in each of the X, Y and Z directions, and also from the magnitude of the magnetic field. The DC field magnitude is also measured for comparison.
For the magnetic field sensor readings, the x-Axis is along the width of the meter in the direction from left to right. The y-Axis is along the height of the meter in the direction from bottom to top. The z-Axis is out of the plane of the device towards the viewer. The origin will be where the magnetic field sensor is located inside your device.
The meter is split into two displays. The upper display shows either a gauge or a graph of the gauge values over time. The lower display shows either sampled B-field values or the Fast Fourier Transform (FFT) of them.
The zero button resets averaging and clears the graphs.
The pause button pauses measurement until it is pressed again.
To see the AC rms field values change, shake or rotate a magnet nearby (but not too close - don't unnecessarily saturate the sensor) to your device to see its affect on each of the magnetic field axis. Whilst the app can be used to demonstrate detection of low frequency AC current flowing in a wire, it should NEVER be used for detecting hidden cables or other such tasks - please stay safe and always use a suitable calibrated more accurate device when required.
Don't put a strong magnet too close to your device – you risk damaging the sensor/device. However, waving your device around in all three axis should restore the magnetic field sensor to good working order.
Note that magnetic field sensors will vary in sampling speed, resolution and accuracy from one device to the next. Therefore this app is for indication only.
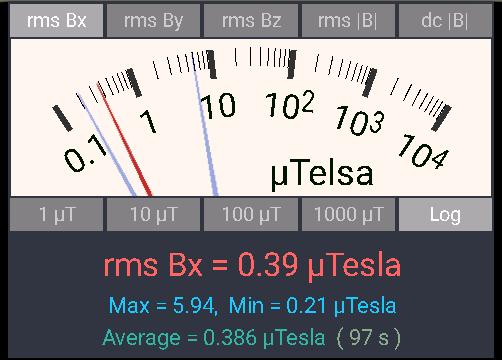
Gauge
The gauge can be set to show the rms field in the X, Y or Z directions, or the rms of the magnitude of the field, or the DC magnetic field by tapping on the corresponding button above the gauge.
There are 5 resolutions for the gauge which can be selected below the dial. The selected range is shown in a lighter colour.
By long pressing on the results, the current reading, max, min and average values can be saved to the clipboard ready for pasting into another application.
RMS Gauge |
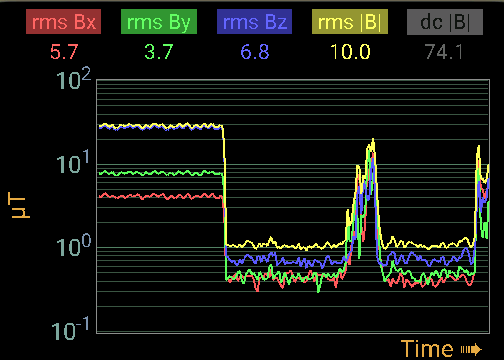
RMS Graph
Above the RMS graph are 5 buttons ( rms Bx, rms By, rms Bz, rms |B| and dc |B| ) which will turn each of the 5 avaliable traces on or off.
The y-Axis of the graph can be set to be logarithmic or linear in the settings.
The graph y axis is auto scaling by default. When paused or not in autoscale mode, double touching and stretching or pinching will scale the graph. Single touch panning will move the y-Axis scale up or down, or allow scrolling back to see earlier data on the x-axis.
RMS Time Graph |
Speed
The speed arrows control the sample speed for the data for the time series and FFT graphs in the lower display. The measurement frequency can be changed between 12 preset values (0.5 Hz, 1 Hz, 2 Hz, 5 Hz, 10 Hz, 20 Hz, 50 Hz, 100 Hz, 200 Hz, 500 Hz, 1 kHz and 2 kHz). The data is re-sampled for these frequencies, so going above the speed capability of your device will just result in multiple samples with the same reading. Sampling above the sensor's max measurement speed will also result in FFT traces becoming grey at above half the sensor's max sampling speed indicating that the data should be ignored. The measured sensor sampling speed is shown along with other sensor details at the top the info/user guide page in the app.
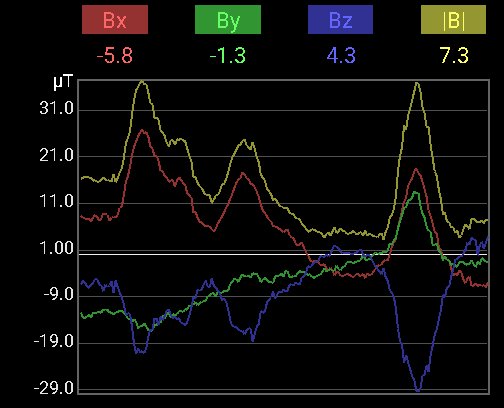
Time Series Graph
This graph shows the magnetic field values versus time. It is auto scaling by default and scrolls once filled. Auto scale can be turned on or off in the settings.
When auto scale is off, or the detection is paused, the graph can be manually scaled. A single touch allows the graph y axis scale to be moved up or down, or in the case of the x-axis, pan back to see more recent data. A double touch, i.e. pinching on the graph can change the scales of either axis. Since the graph is small, using fingers on opposite hands can make this task much easier.
There are up to 4 traces shown on the graph corresponding to Bx, By, Bz and |B|. They can be turned on of off at the top of the graph by tapping on the corresponding character.
Time Series graph |
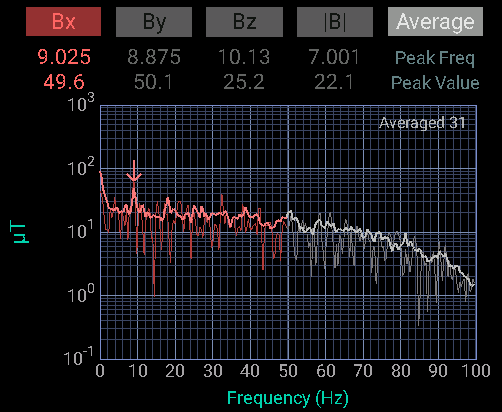
FFT Graph
The Frequency Spectrum is selected with the FFT graph button at the bottom right. The FFT of the X, Y, Z and magnitude channels can be turned on or off with the corresponding buttons above the graph.
If the average button is selected, then in addition to the most recent FFT, an average of all the FFTs done since the FFT settings were changed or zero was pressed is also shown. The number of averaged traces is shown in the top right of the graph.
The FFT is not shown until at least sufficient data to fill the time series is obtained. This will depend on the sampling speed and FFT size. The time required to obtain this data is equal to the FFT size divided by the sample rate. Whilst the initial data is being gathered, a progress screen will be displayed instead of the FFT.
Both the axes can be either on logarithmic or linear scales as selected in the settings. The graph is by default auto scaling, but when this is off or the sampling is paused, then the graph can be scaled or panned as with the other graphs.
FFT Graph |
Settings
Clicking the cogs button at the top left of the screen brings up a settings menu:
Magnetic Field Units – The magnetic field will be shown in either in units of µT, or units of Gauss.
Stay awake – Check this option to stop the device from sleeping.
Sound On – Button presses will make a click sound if this is enabled.
Reset to defaults – Resets all preferences back to their default values and clears the graph data.
RMS Graph Y-Axis Scaling - The Y-Axis of the graph can be logarithmic or linear.
Auto scale RMS graph Y-Axis - The Y-Axis of the graph will be auto scaled when not paused. Otherwise panning or pinching on the graph can change the axis scales.
RMS Graph Update Speed - The update speed of the RMS graph and gauge can be changed to one of three preset values.
Save RMS Graph Data - Saves a comma separated text file containing the data from the RMS graph. Data file will include all 5 traces regardless of whether they are currently displayed on the graph. Files are saved in a 'keuwlsoft' directory on your device. In version 1.10 and above of the app, files are saved in the documents folder in a \keuwlsoft\ac_magnetic_field_meter sub directory.
FFT Graph X-Axis Scaling - The Frequency Axis of the FFT graph can be set to be a logarithmic or linear scale.
FFT Graph Y-Axis Scaling - The Y-Axis of the FFT graph can be set to be a logarithmic or linear scale.
Auto scale FFT graph Y-Axis - Both axes of the FFT graph will be auto scaled when not paused. Otherwise panning or pinching on the graph can change the axis scales.
Auto scale Time graph Y-Axis - The Y-Axis of the time series graph will be auto scaled when not paused. Otherwise panning or pinching on the graph can change the axis scales.
Coupling for FFT and Time Graphs Select between AC and DC coupling of the data for the lower display. AC coupling applies a high pass filter to the raw XYZ data, thus removing its DC component. For example, without AC coupling a DC offset might overwhelms the FFT spectrum at the low frequency end.
FFT Update Speed - Once sufficient data has been received for the initial FFT, the FFT will be redone at an interval determined by this setting.
FFT Size - Select how many data points to use in the fast Fourier transform. The smaller the size, the faster the FFT becomes, but with lower frequency resolution. The number of data points in the frequency spectrum will be half the FFT size.
Save Time Graph Data - Saves the raw sampled data from the lower display time series graph. The data file will include all 4 traces regardless of whether they are currently displayed on the graph. Files are saved in a 'keuwlsoft' directory on your device. In version 1.10 and above of the app, files are saved in the documents folder in a \keuwlsoft\ac_magnetic_field_meter sub directory.
Save FFT Graph Data - Saves the frequency spectrum data from the lower display FFT graph. The data file will include all 4 traces and their averages regardless of whether they are currently displayed on the graph. Files are saved in a 'keuwlsoft' directory on your device. In version 1.10 and above of the app, files are saved in the documents folder in a \keuwlsoft\ac_magnetic_field_meter sub directory.
Saved data files are Comma Separated ASCII and should be self explanatory once opened.